The number the Paris Agreement was written around has now been reached, at least briefly. 2024 closed at 1.60C above the 1850-1900 baseline, the warmest year in the instrumental record and the first calendar year to exceed 1.5C1. 2025 came in at 1.47C, third warmest, a hair behind 20232. And the three years together did something no single year can: 2023 through 2025 averaged above 1.5C, the first multi-year period past the marker2. The past eleven years are the eleven warmest ever measured2.
There are two opposite ways to misread this, and January's headlines managed both. The first is declaring the Paris target dead: the treaty's 1.5C refers to a long-term average, which scientists conventionally take as twenty years because the treaty itself fixes no period, so a single El Nino-boosted year, or even three warm ones, does not constitute a breach in the agreement's terms1. The second mistake is taking comfort in that footnote. At the observed warming rate of more than 0.2C per decade, the twenty-year average crosses 1.5C in the 2030s on essentially every published trajectory3, and a peer-reviewed reading of 2024 concluded the Earth is most probably already inside the twenty-year window that will define the crossing3. A single year is a preview, not the crossing; on current rates, the crossing itself is close behind.
2024 and 2025 against the pre-industrial baseline. The 2023-25 average exceeded 1.5C, a first.
What pushed the record
The 2023-24 spike ran ahead of the trend line, and its decomposition matters for what comes next. The steady term is greenhouse forcing, rising monotonically with atmospheric concentrations that set records every year. On top of it stacked a strong El Nino, redistributing Pacific heat into the atmosphere; the cleanup of sulphur from shipping fuels, which brightened the marine haze that had been quietly shading the oceans; and an unusually quiet stretch of volcanic and solar variability. 2025's slight step down as La Nina conditions returned is exactly what that arithmetic predicts2: the cycle swings up and down, the baseline underneath keeps climbing, and each El Nino now peaks from a higher floor than the last.
The oceans carry the part of the story the air-temperature headlines miss. More than 90% of the accumulated energy imbalance resides in seawater, where record heat content has bleached reefs through consecutive global events, fuelled rapid hurricane intensification, and pushed sea level rise along its accelerating track. Ocean heat has no La Nina years; its series simply rises, which is why scientists treat it as the planet's most reliable gauge. It did not pause through 2025, which rules out reading the surface dip as relief.
The measurement itself is worth pausing on, because everything in this piece rests on it. The 1.5C is measured against 1850-1900, a baseline stitched from ship logs, station records, and statistical reconstruction; the modern anomaly comes from reanalysis systems like ERA5 that assimilate satellites, buoys, and stations into a single global field. Different groups, NASA, NOAA, the UK's Hadley Centre, Berkeley Earth, Japan's JMA, run different methods over different subsets and land within hundredths of a degree of each other, year after year2. That convergence matters: few politically contested quantities are measured this redundantly, by this many rival groups, with this much agreement.
A common objection is that a global mean hides everything a person actually feels. True, but what it hides is not reassuring: land warms faster than the 1.5C average because oceans drag it down, the Arctic warms at multiples of it, and the tail events, the heat domes, the stalled monsoons, the marine heatwaves, scale with the extremes rather than the mean. A world 1.5C warmer on average is not a world where afternoons run 1.5C warm. It is a world where the old once-a-century afternoon arrives on a schedule.
What 1.5 was, and was not
The 1.5C figure entered the treaty as diplomacy before it was science: the small-island states' non-negotiable, adopted in 2015 as an aspiration alongside the 2C 'well below'. The science arrived in 2018, when the IPCC's special report catalogued the differences between 1.5 and 2: roughly twice the coral loss, an ice-free Arctic summer per decade instead of per century, meaningful increments of crop stress, water scarcity, and heat mortality. Nothing in that catalogue makes 1.5 a cliff edge; every tenth is continuous, and 1.6 is worse than 1.5 by about as much as 1.5 is worse than 1.4. The marker keeps its scientific meaning anyway: each tenth carries a measurable increment of risk, and slow systems such as ice sheets and reefs respond to how long warmth is sustained, so the difference between touching 1.5 and settling above it is physical, not symbolic. The threshold's real function was always to anchor ambition and to timestamp failure, and it is performing the second function now with some precision.
The overshoot conversation has therefore moved from whether to how far and how governed. Every pathway that returns to 1.5 late this century runs through net negative emissions, removing carbon at gigatonne scale by means that today exist as pilots and promises; the serious policy question underneath is what peak temperature the overshoot touches and how long it lingers, because ice sheets and permafrost respond to peaks, not averages. Meanwhile the tail risks with thresholds of their own, the Atlantic circulation among them, have migrated from the literature's margins to its centre, less because probabilities rose than because the cost of being wrong stopped being hypothetical.
Marker | Value |
|---|---|
2024 anomaly vs 1850-1900 | 1.60C; warmest year on record |
2025 anomaly | 1.47C; third warmest, 0.01C behind 2023 |
2023-25 average | Above 1.5C, a first for any three-year period |
Warmest years on record | The last 11, consecutively |
Observed warming rate | More than 0.2C per decade |
20-year average crosses 1.5C | In the 2030s, on current trajectories |
The politics of the crossing are already visible, and they run opposite to the fatalism it might seem to justify. The years since 1.5C became touchable have seen climate liability suits multiply, central banks stress-test transition scenarios, and the loss-and-damage architecture agreed at the COPs move from principle to fund, because a dated, measured failure converts diffuse grievance into standing. 'We passed the number you promised to hold' is a sentence with legal and diplomatic uses that 'the climate is changing' never had. Small-island diplomats, who put 1.5 in the treaty, always understood that the marker would matter most after it was passed.
It changes climate negotiations too. The carbon budget consistent with returning to 1.5 is small enough that every new field, fleet, and furnace is now arithmetically someone else's foreclosed emissions, which is why border carbon instruments like Europe's CBAM, and the scramble for transition minerals, are climate policy conducted through trade policy. Post-1.5 politics is about allocation: the atmosphere's remaining capacity is now a scarce resource, and it is being contested like one.
What is racing the record
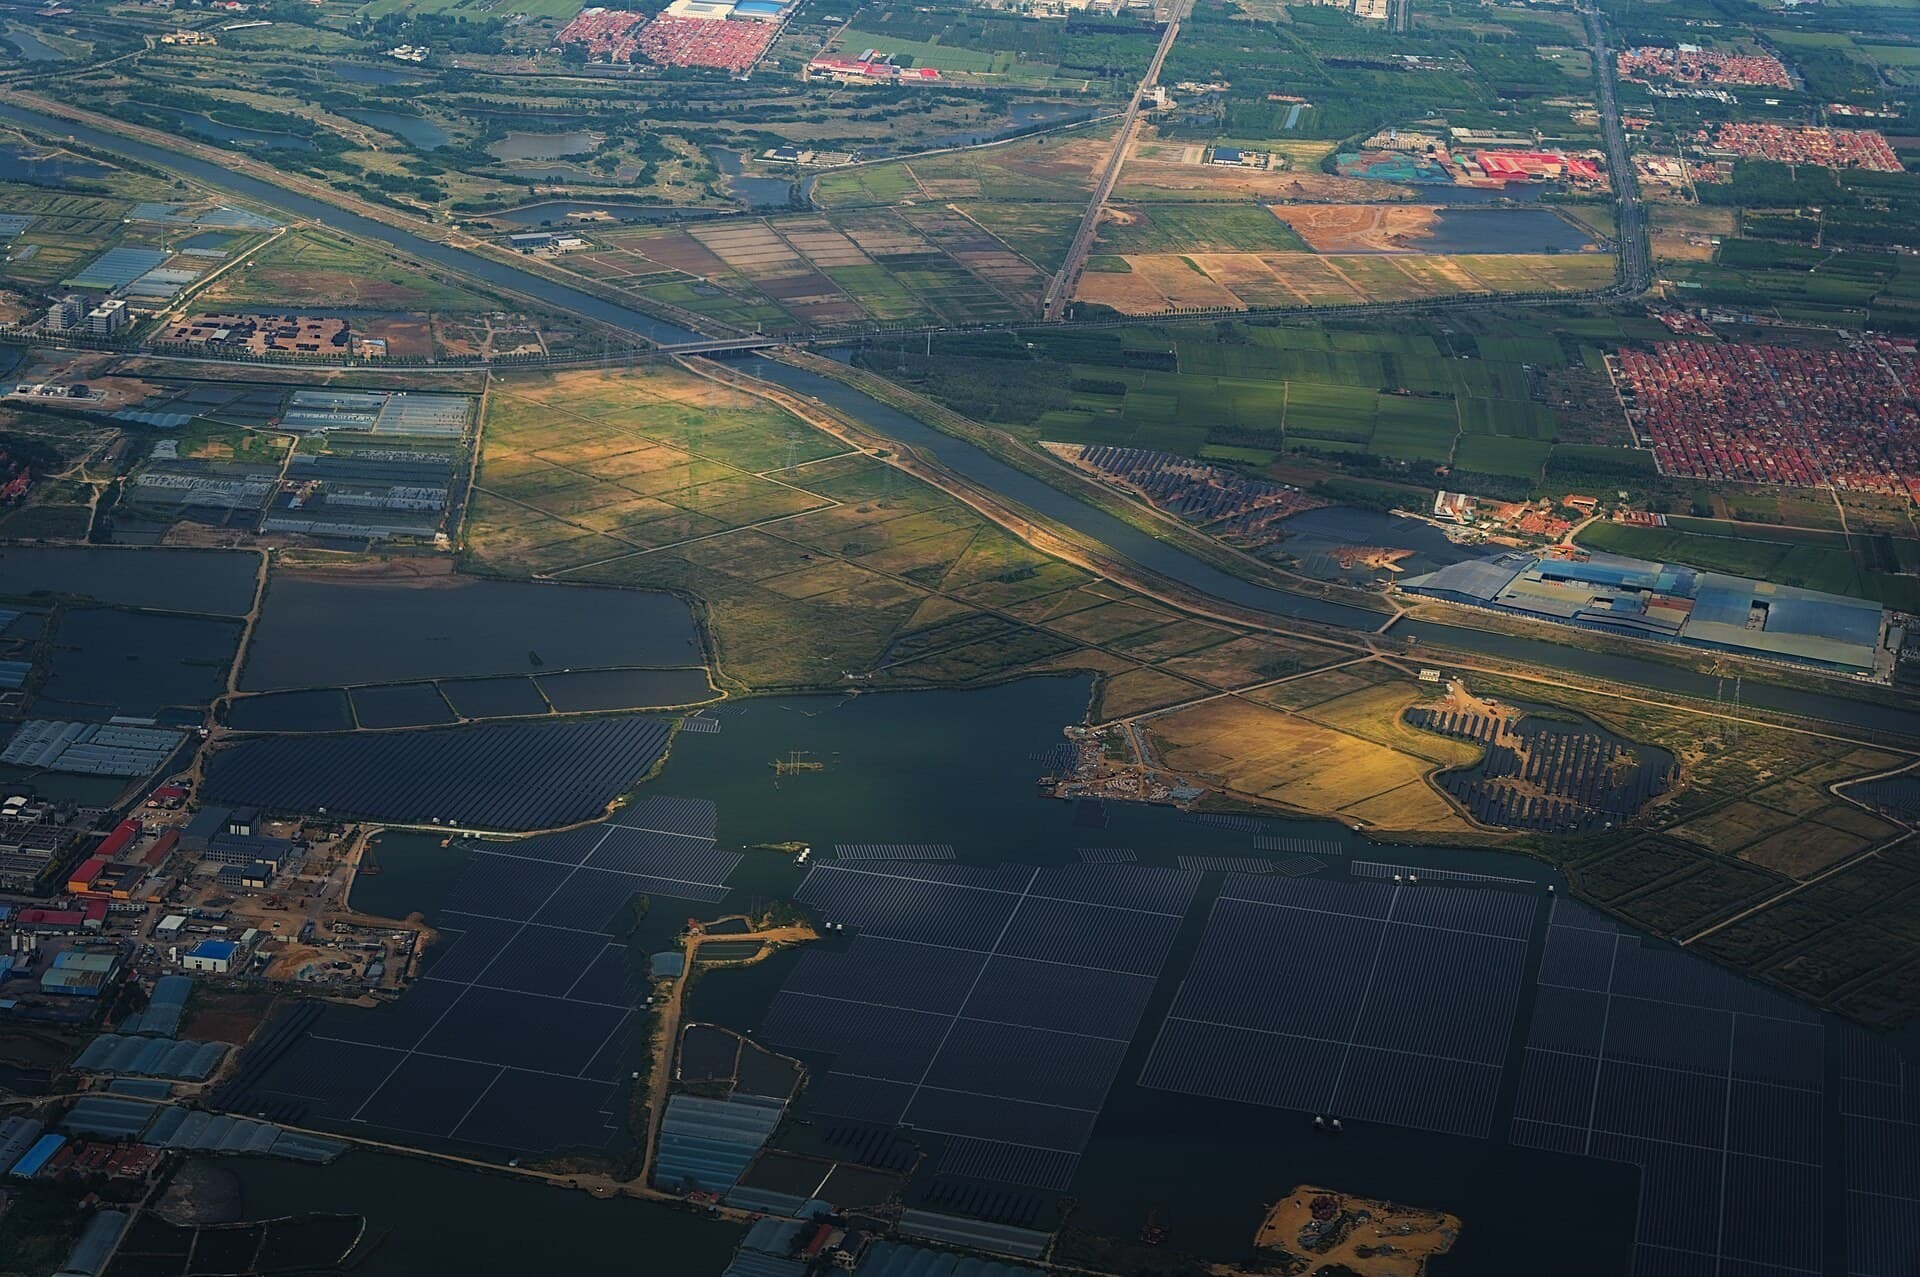
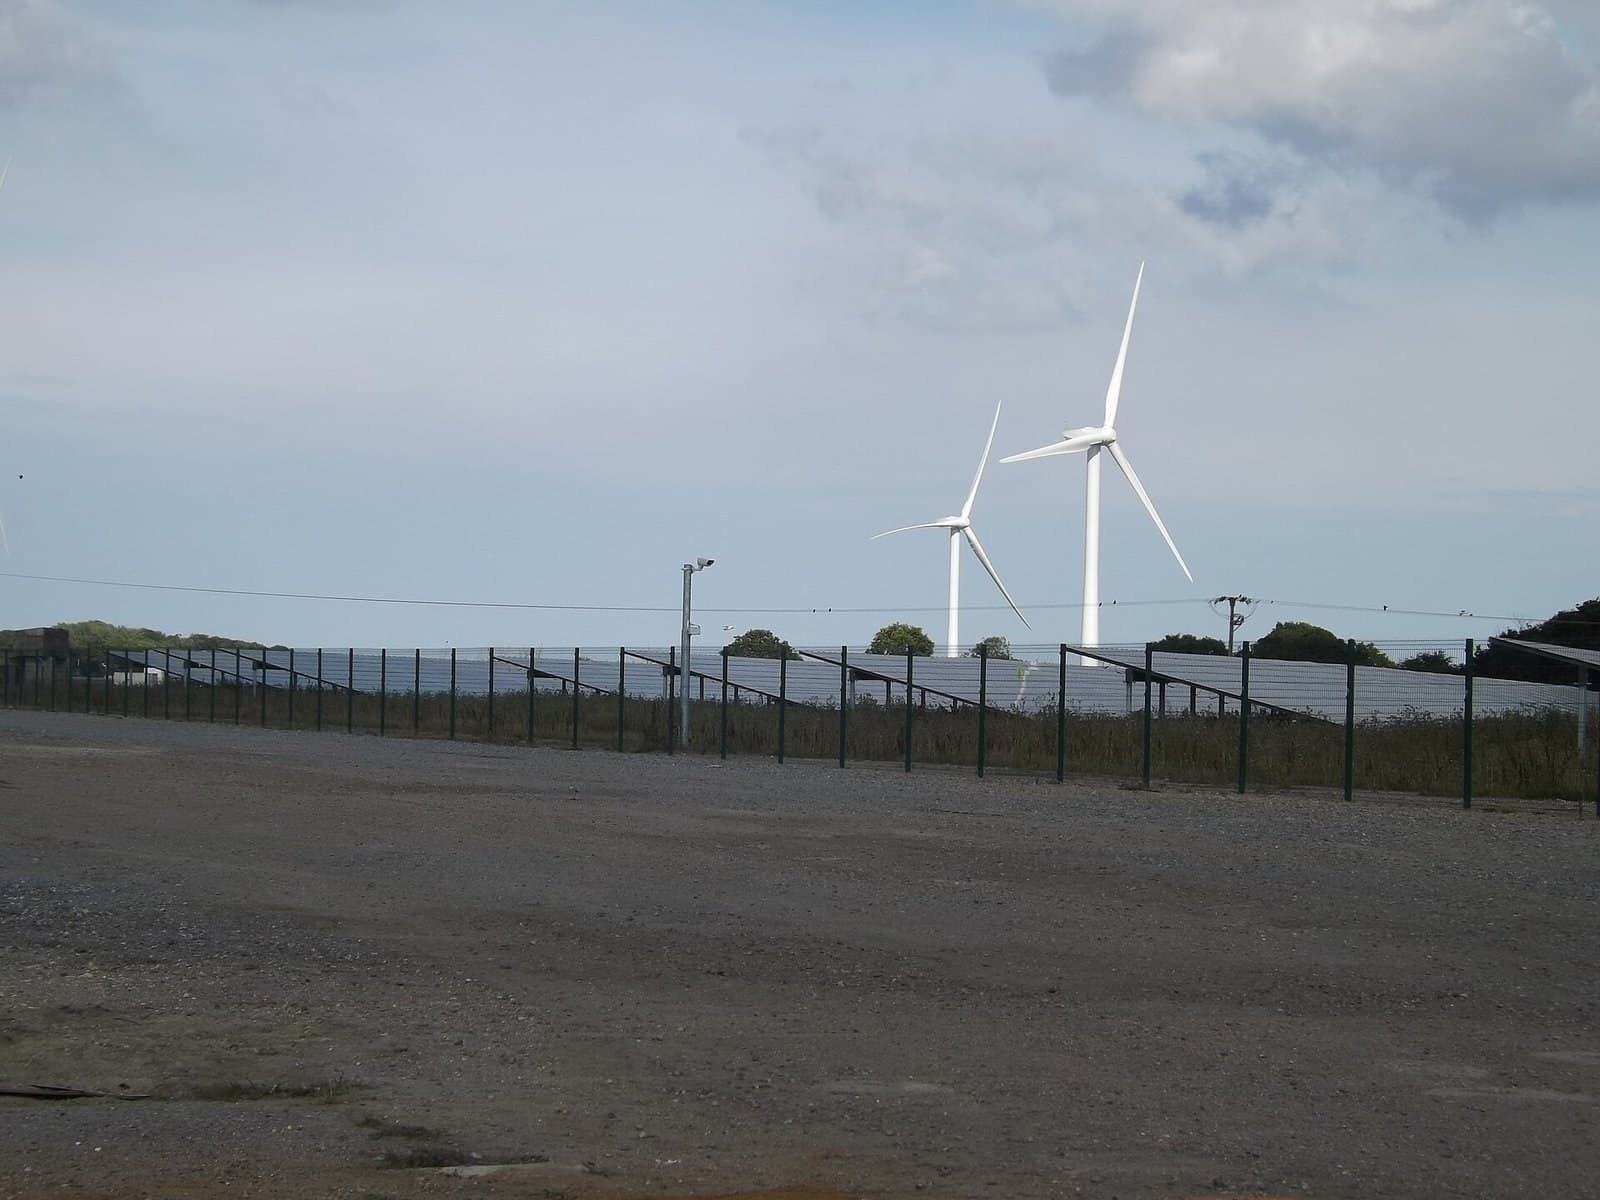
The bleak numbers above coexist with the most hopeful ones in this publication, and they belong in the same piece. The energy transition's hardware is deploying at rates the 1.5 pathways once labelled heroic: a record 647 gigawatts of solar in 2025, batteries beating gas's best-ever build year, nuclear's order book reopening, electric vehicles at majority share in the world's largest car market. Emissions have plateaued in the OECD and, on 2025's evidence, possibly in China. What the deployment has not yet done is bend the concentration curve, because energy demand grows, fossil capacity retires slowly, and a plateau is not a decline. There is a genuine race here: the warming rate that points to a 2030s crossing assumes yesterday's energy system, and the energy system is the one variable moving faster than projected.
Adaptation, long the neglected half of climate policy, is being repriced year by year: the Panama Canal rationing transits on rainfall, insurers retreating from floodplains and fire zones, fertilizer and harvests riding water availability, Morocco building desalination alongside its solar. At 1.5C-and-climbing, adaptation stops being a developing-world agenda item and becomes infrastructure policy everywhere, priced in basis points and premiums rather than pledges.
Closer to home, the crossing is not an abstraction with a decade's grace. North Africa sits in one of the world's strongest drying belts, where each global tenth of a degree arrives amplified in reservoir levels, snowpack in the Atlas, and the groundwater beneath the phosphate belt's farms. Morocco's desalination and solar programmes are the response side of the same story: infrastructure built for the climate the instruments already record, not the one the treaty still promises.
What to watch
Four series, updated annually and none of them negotiable. The twenty-year mean's approach to 1.5C, the only number that will settle the treaty question3. The annual concentration increment at Mauna Loa, because it, not any emissions pledge, is what the atmosphere has actually received. The first ice-free Arctic September, a threshold with a date attached within most readers' lifetimes. And the peak-year estimate in each IPCC cycle, because the difference between an overshoot that tops out at 1.7C and one that reaches 2.5C is the difference between an expensive century and a transformed planet. The measurements will arrive on their own schedule either way.
Copernicus Climate Change Service, 2024 is the first year to exceed 1.5C above pre-industrial level: 1.60C above 1850-1900; warmest year on record; the Paris target defined against a long-term average, so a single year is not a breach.
Copernicus Climate Change Service, 2025 was the third hottest year on record: 1.47C above pre-industrial, 0.01C behind 2023 and 0.13C behind 2024; 2023-25 the first three-year period averaging above 1.5C; the last 11 years the 11 warmest.
Bevacqua et al., A year above 1.5C signals that Earth is most probably within the 20-year period that will reach the Paris Agreement limit, Nature Climate Change (2025); warming rate above 0.2C per decade.